
MWHS, the Skylar Electricity Futures ETF, offers exposure to U.S. power futures rather than shares of utility companies. Its strategy principally uses contracts associated with ERCOT and PJM. This is a specialized way to approach electricity markets, not a diversified ownership stake in the companies delivering power to homes. The distinction is the starting point for understanding an eye-catching gain on a market screen. How the strategy works.
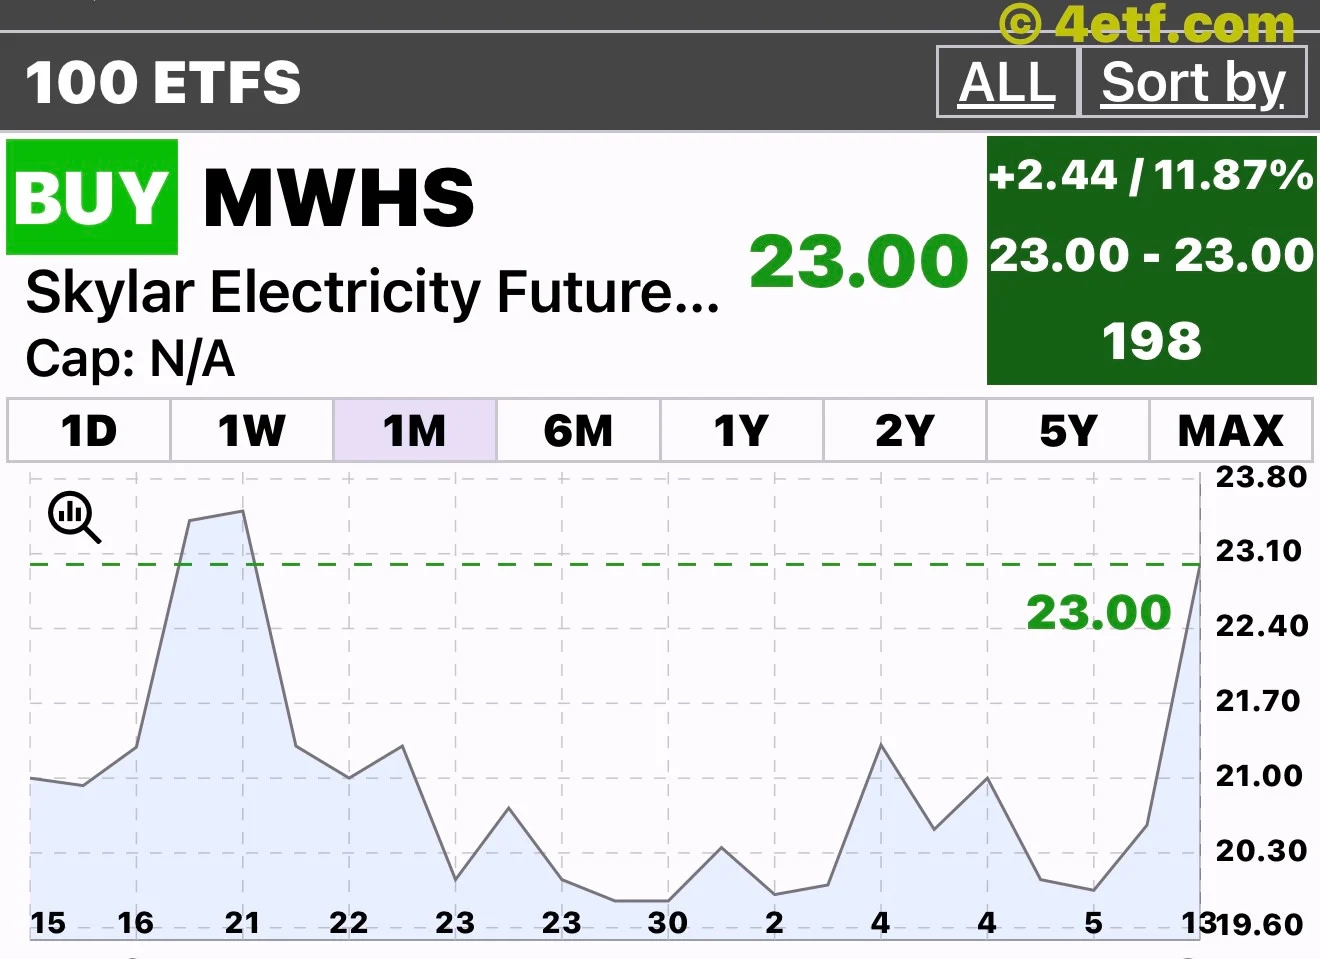
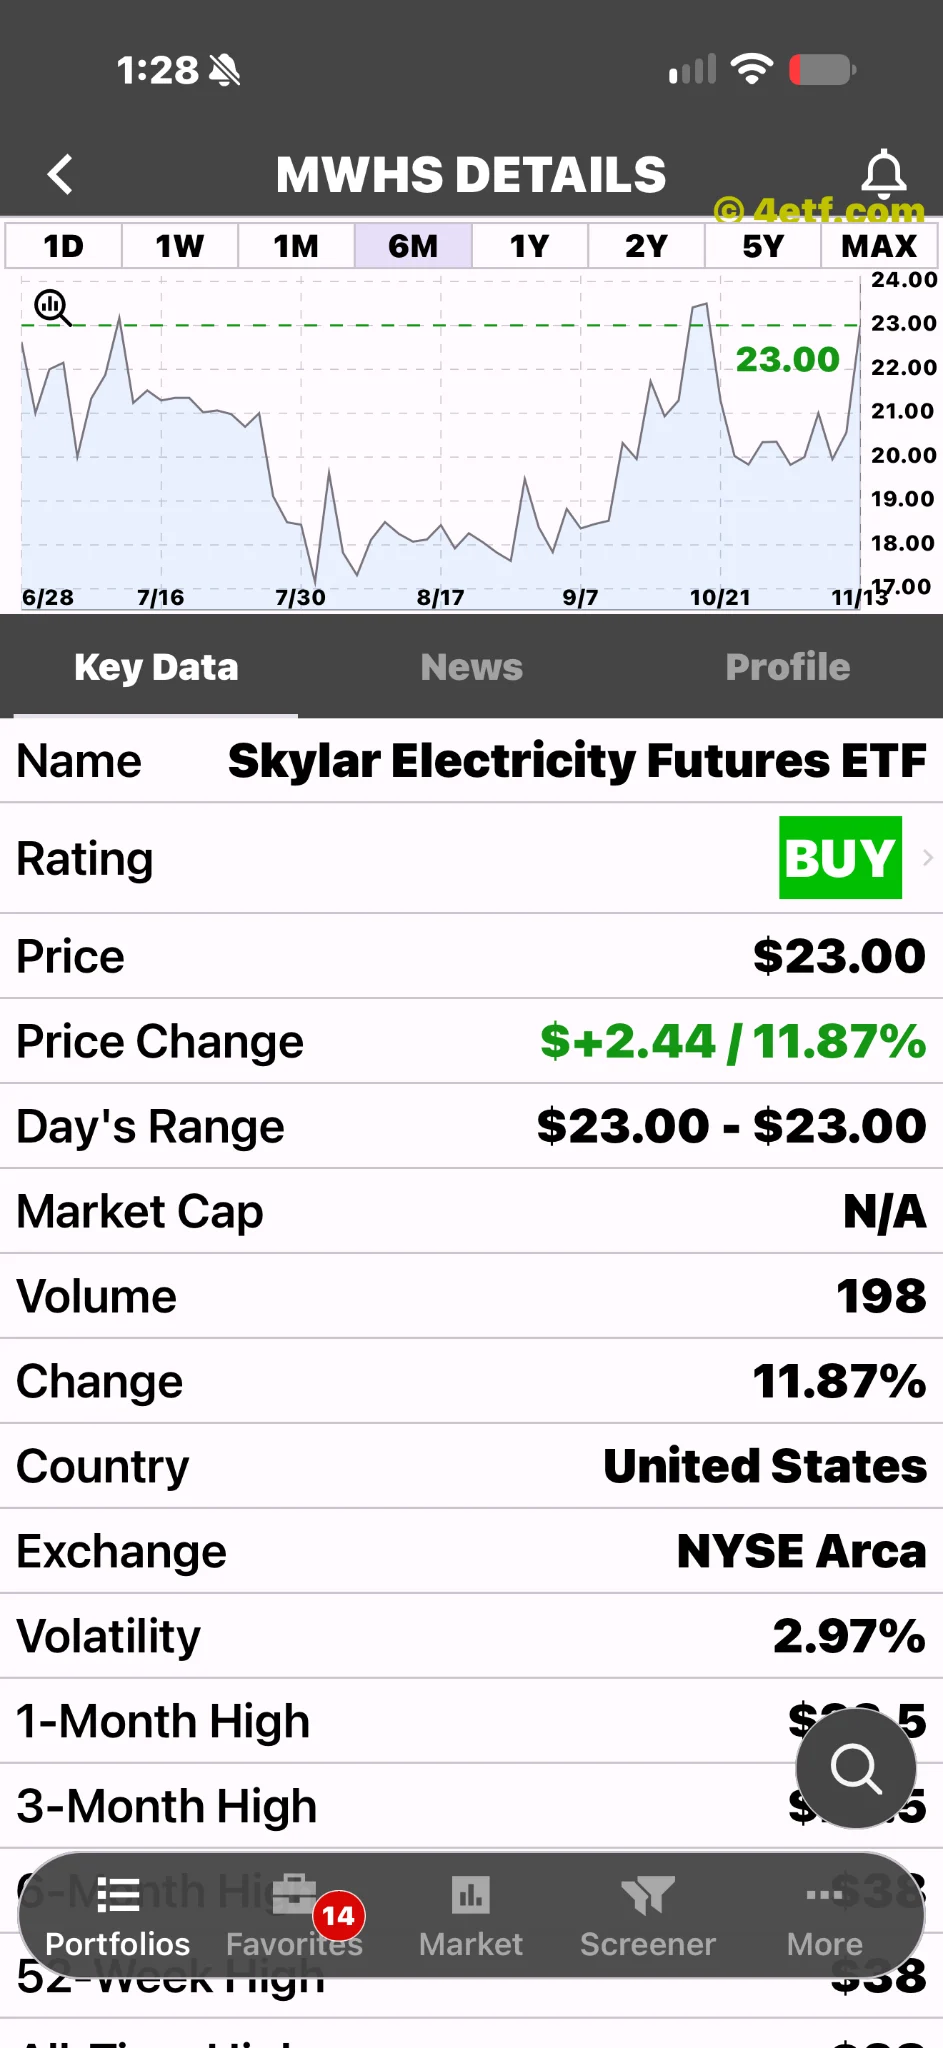
The supplied longer chart runs from late June to November, not a complete six months: it falls into summer, rebounds toward October, retreats and then jumps again. The one-month chart similarly shows a sharp latest rise after lower trading. Neither is a smooth persistent uptrend. The issuer dates the fund’s inception to June 26, 2026. Fund information.
A small fund with an outsized-looking move
The issuer's figures dated November 12, 2026 show approximately $640,985 in net assets, a net asset value of $21.37 and a market closing price of $20.56. Its published median 30-day bid/ask spread was 19.59%. These dated figures establish scale and a reason to inspect execution carefully; they do not provide today's spread. Issuer data.
Eric's ETFon screen then shows $23.00, a gain of +11.87%, volume of just 198 and a displayed range of $23.00 to $23.00. That is enough to get a trader's attention. It is not enough to demonstrate that the underlying electricity exposure appreciated by the same percentage.
The arithmetic is straightforward: moving from $20.56 to $23.00 is approximately +11.87%. That supports the displayed comparison with the issuer's prior closing market price. It does not establish what the portfolio was worth when the screenshot was taken. A coherent calculation can still leave the most important economic question unanswered.
Electricity is the exposure, not the explanation by itself
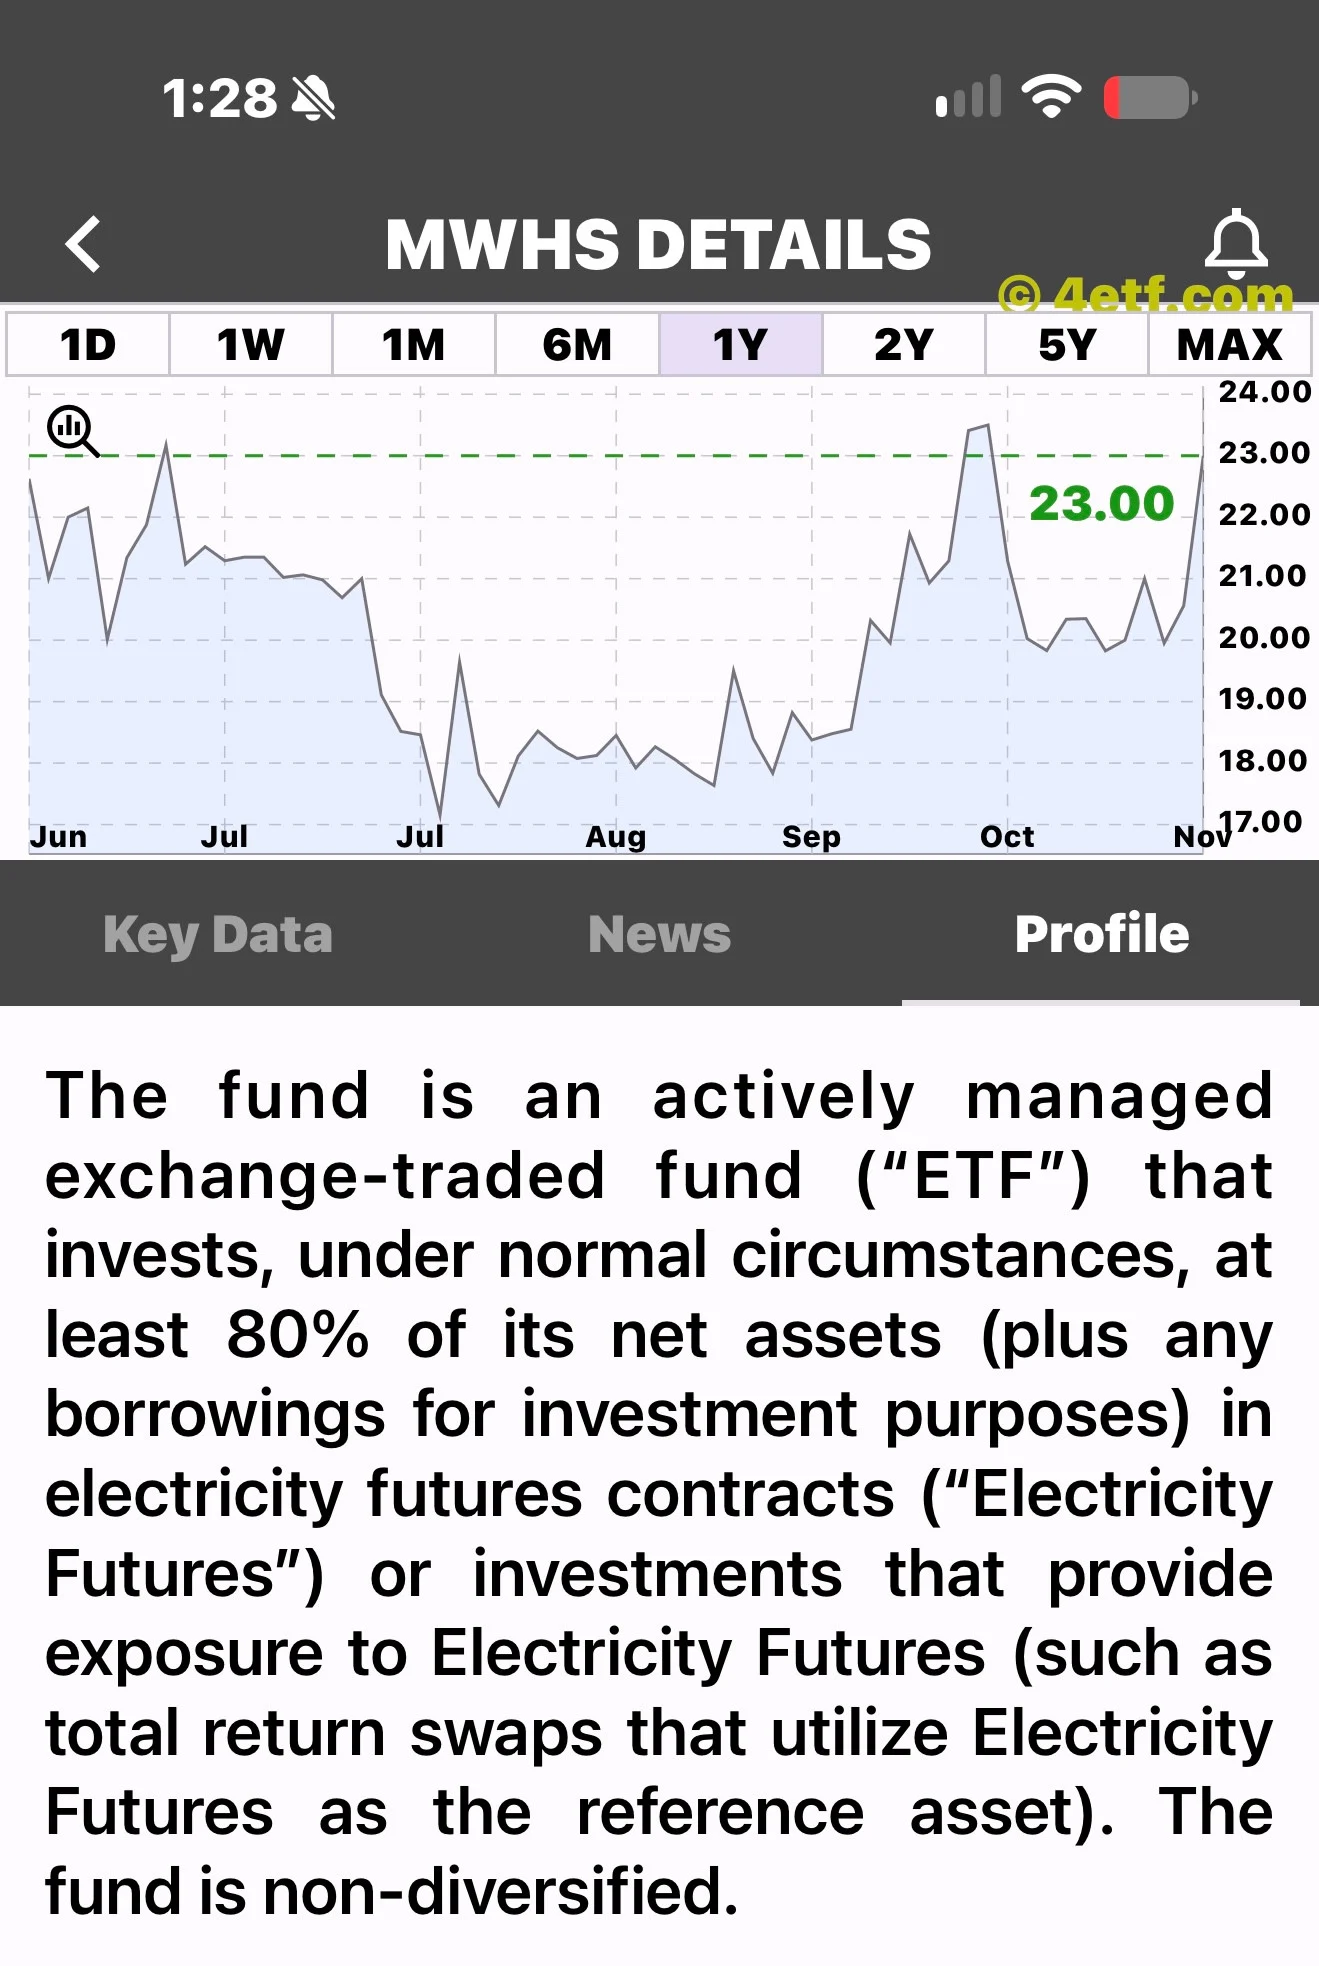
Power futures can respond to weather, fuel costs and grid conditions. Contract selection and rolling exposure also matter. Those mechanisms describe how this strategy can move; they do not establish that a particular weather event or power shortage caused this screenshot's gain. Strategy explanation.
We have not verified a fresh event that explains the entire displayed advance. That is an important limitation, not a gap to fill with a dramatic story about electricity demand. A plausible theme and a documented catalyst are different things. The former can start research; only evidence can turn it into the latter.
Why the trading price deserves its own paragraph
Imagine two instruments with identical underlying exposures but different trading conditions. A recent transaction in one might occur near a fair-value estimate, while the other changes hands at a much wider spread. Their screens can show different percentage moves without proving equally different changes in their economic exposure. This is a general illustration, not a reconstruction of the MWHS transaction.
The displayed volume should also be handled honestly. Without a reliable same-time average and a confirmed session, 198 shares cannot support a statistical claim that interest has collapsed or suddenly surged. It tells us the observation is small in absolute share count. It does not identify who traded, why they traded, or whether demand will persist.
The right story is more useful than the loudest one
Our view is that the innovative exposure is interesting, while the trading frictions are concerning. Both belong in the same article. The next evidence to seek is a current two-sided quote, a comparable portfolio value and verified developments in the contracts actually held. A corporate sales multiple would not solve these questions; this fund is not an operating company selling electricity.
Explore ETF information in ETFon. A striking green number is a reason to ask better questions, not a substitute for the answers.
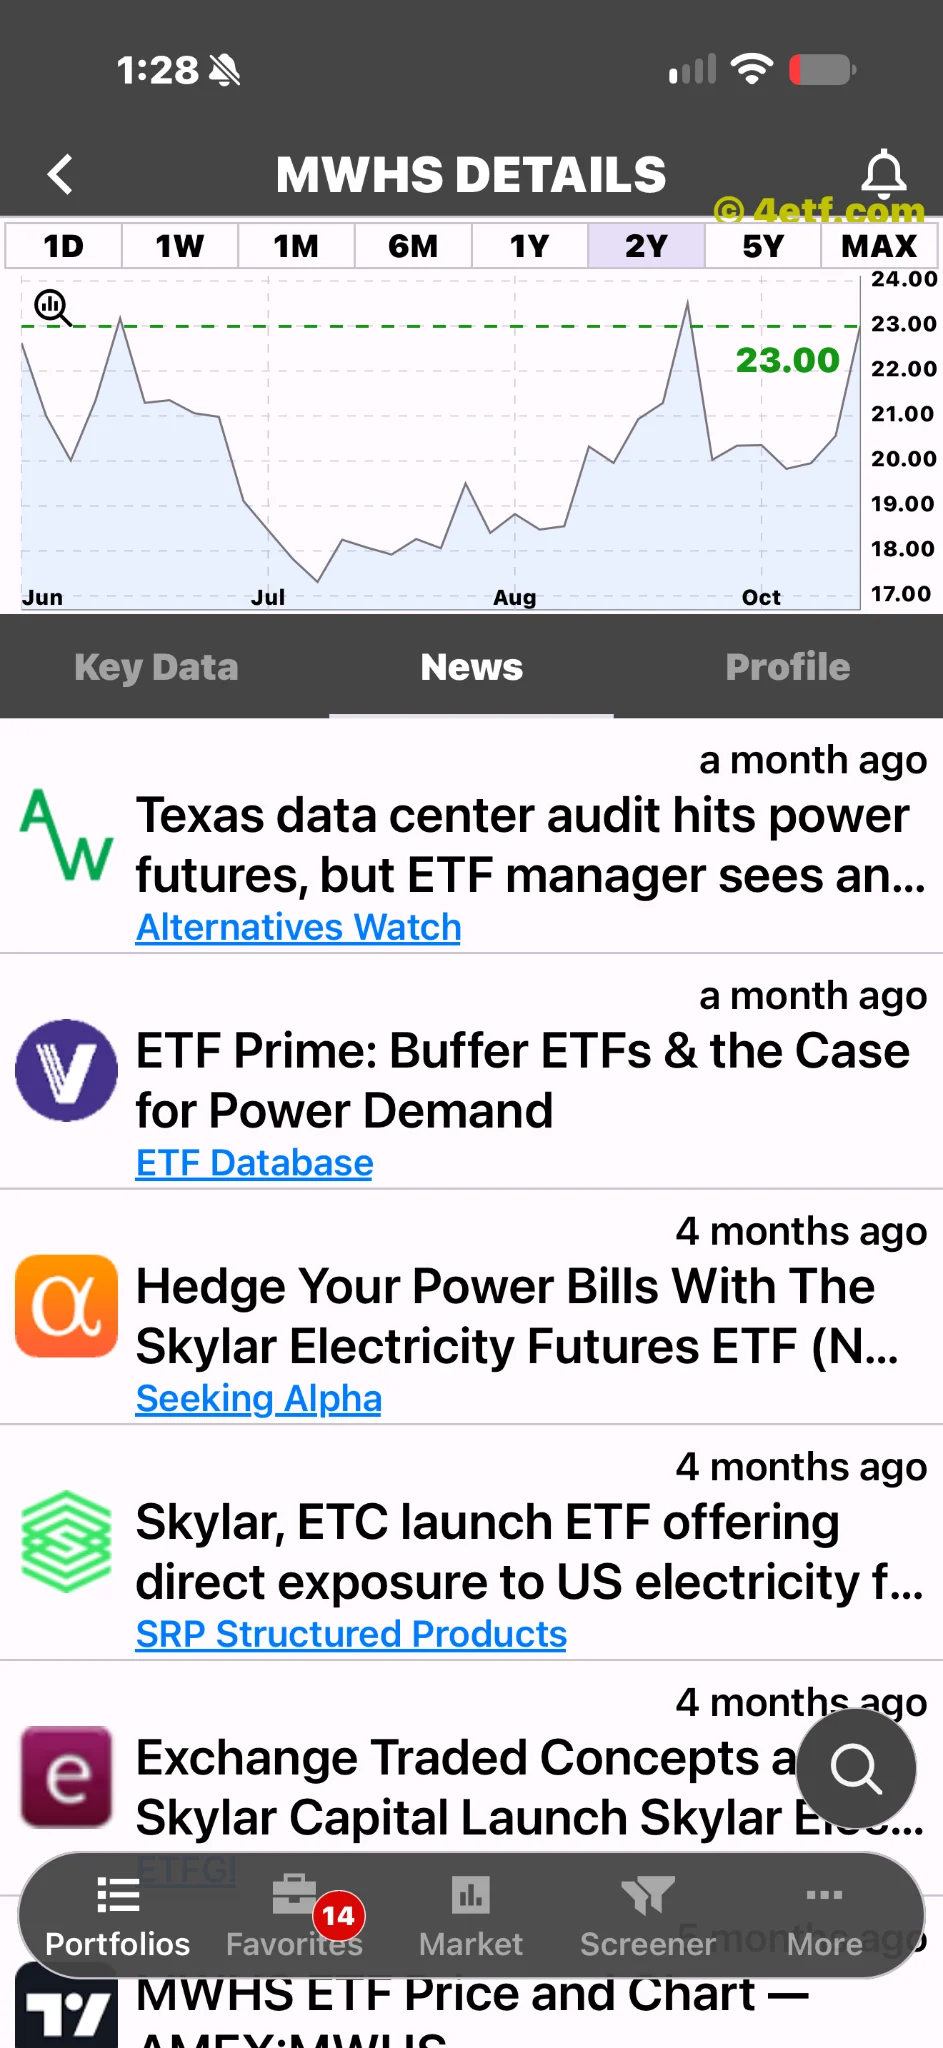
The app’s BUY label is not an independent verification of price or a recommendation from this report. The screenshot’s news entries are at least a month old; we do not present them as today’s catalyst.