
CBRX is the Tradr 2X Long CBRS Daily ETF, designed to amplify one trading day's movement in Cerebras shares. Cerebras itself makes computing systems for artificial intelligence. The distinction matters before anyone celebrates the green number. A buyer is not simply purchasing an inexpensive slice of the chipmaker. The buyer is taking a leveraged position whose behavior depends on both direction and timing. Fund objective.
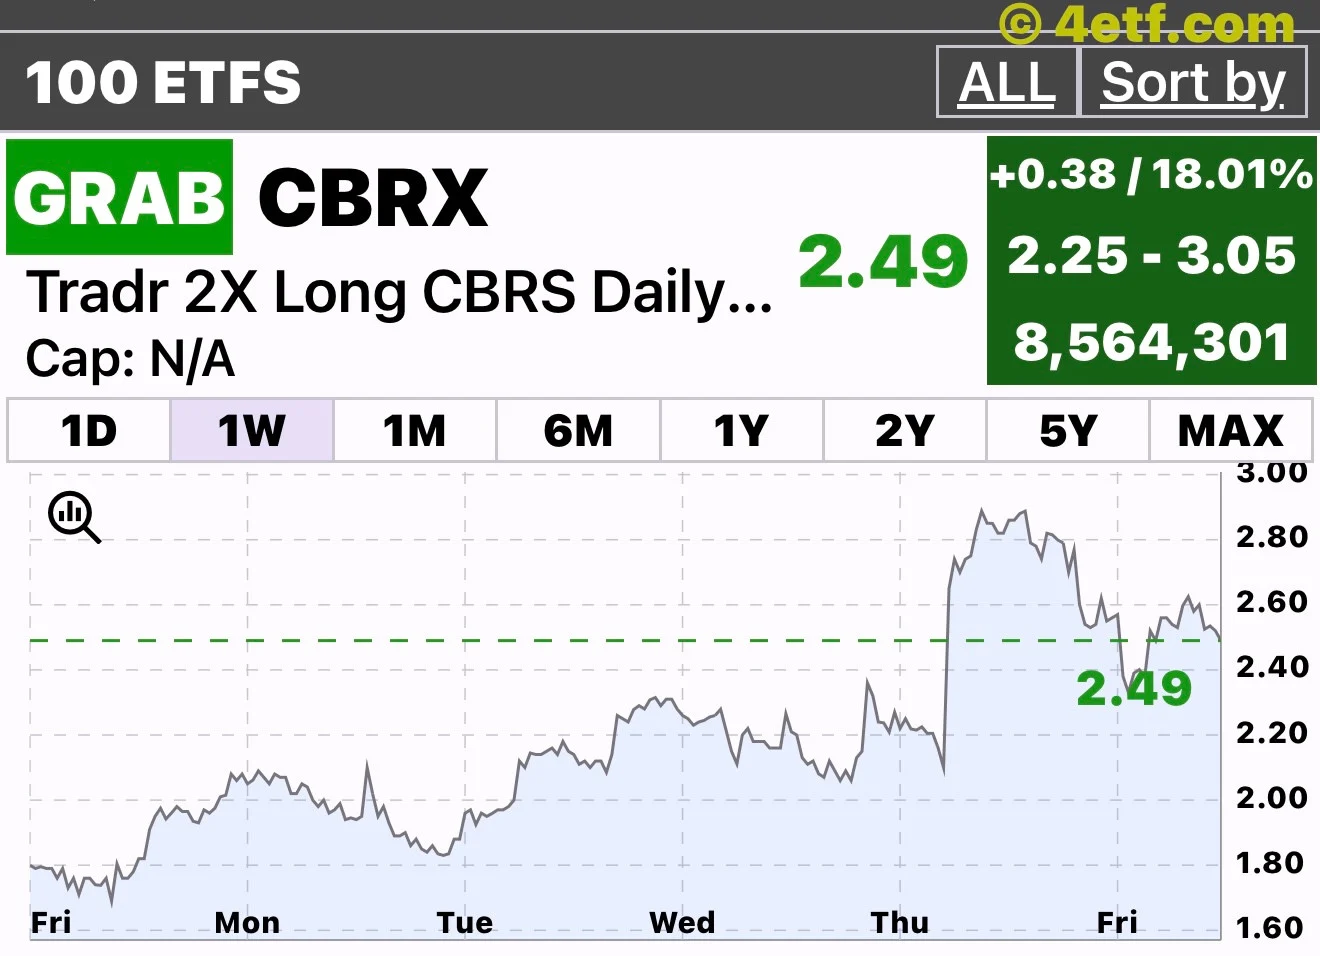
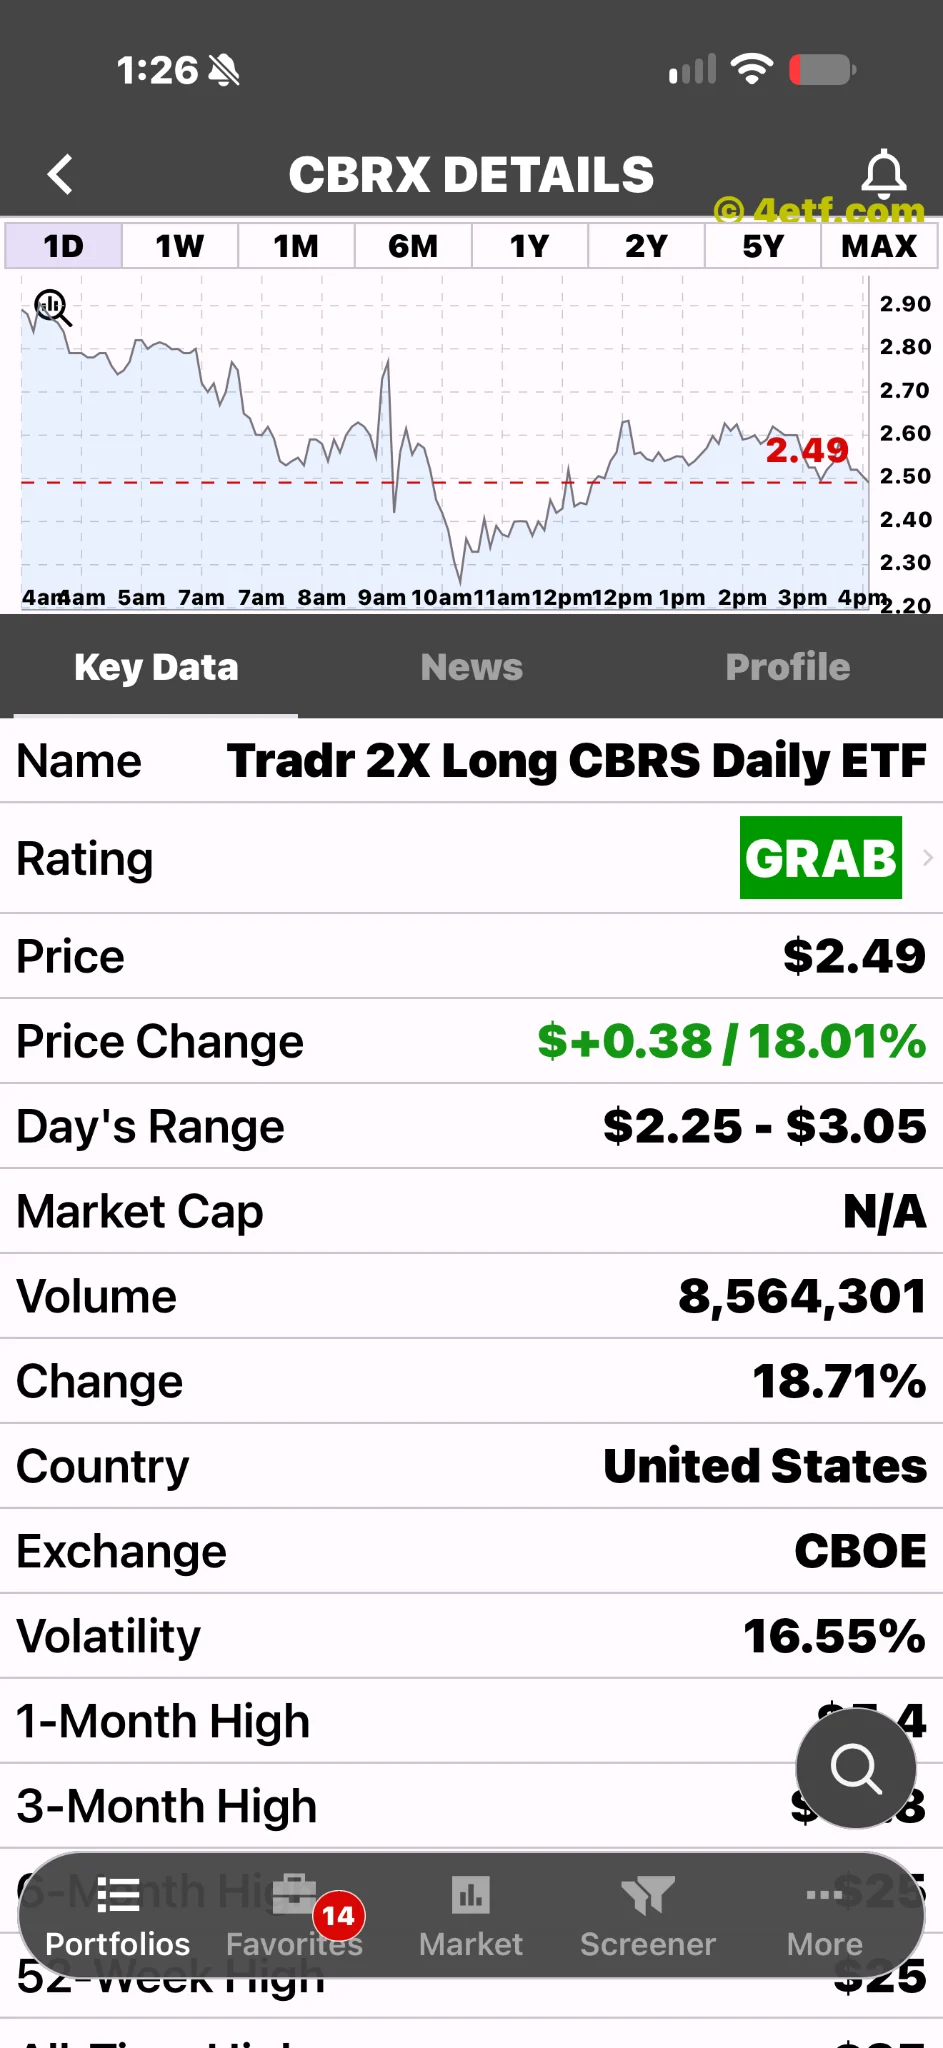
The issuer lists a 1.49% expense ratio. Its embedded live-data panel returned placeholders rather than a dated AUM figure, so fund size is not asserted. The supplied one-week chart generally rises before a late pullback; the one-day view instead retreats from its early high, partially recovers, then eases again. No six-month chart has been supplied, so a longer trend is not inferred.
This rally has a business story behind it
Cerebras reported September-quarter GAAP revenue of $210.81 million and a $161.22 million net loss on November 12, 2026, yesterday relative to this review. September 30 working-capital loans totaled $829.08 million; borrowing capacity is not outstanding debt. Its 2026 core-revenue forecast was $940–960 million, a non-GAAP measure. These are company figures, not the ETF's. Company financial statements.
The constructive story is growth and the higher outlook, not GAAP profitability. No next confirmed earnings date was established. A fund P/E would be misleading; no verified underlying-company valuation multiple is asserted.
That is the encouraging part. Investors had fresh information to reassess, rather than only a rising price to chase. Better expectations can change what buyers are willing to pay for a business. They do not, however, remove the harder question: how much improvement was already in the price, and how much must still be delivered?
What the screenshot actually establishes
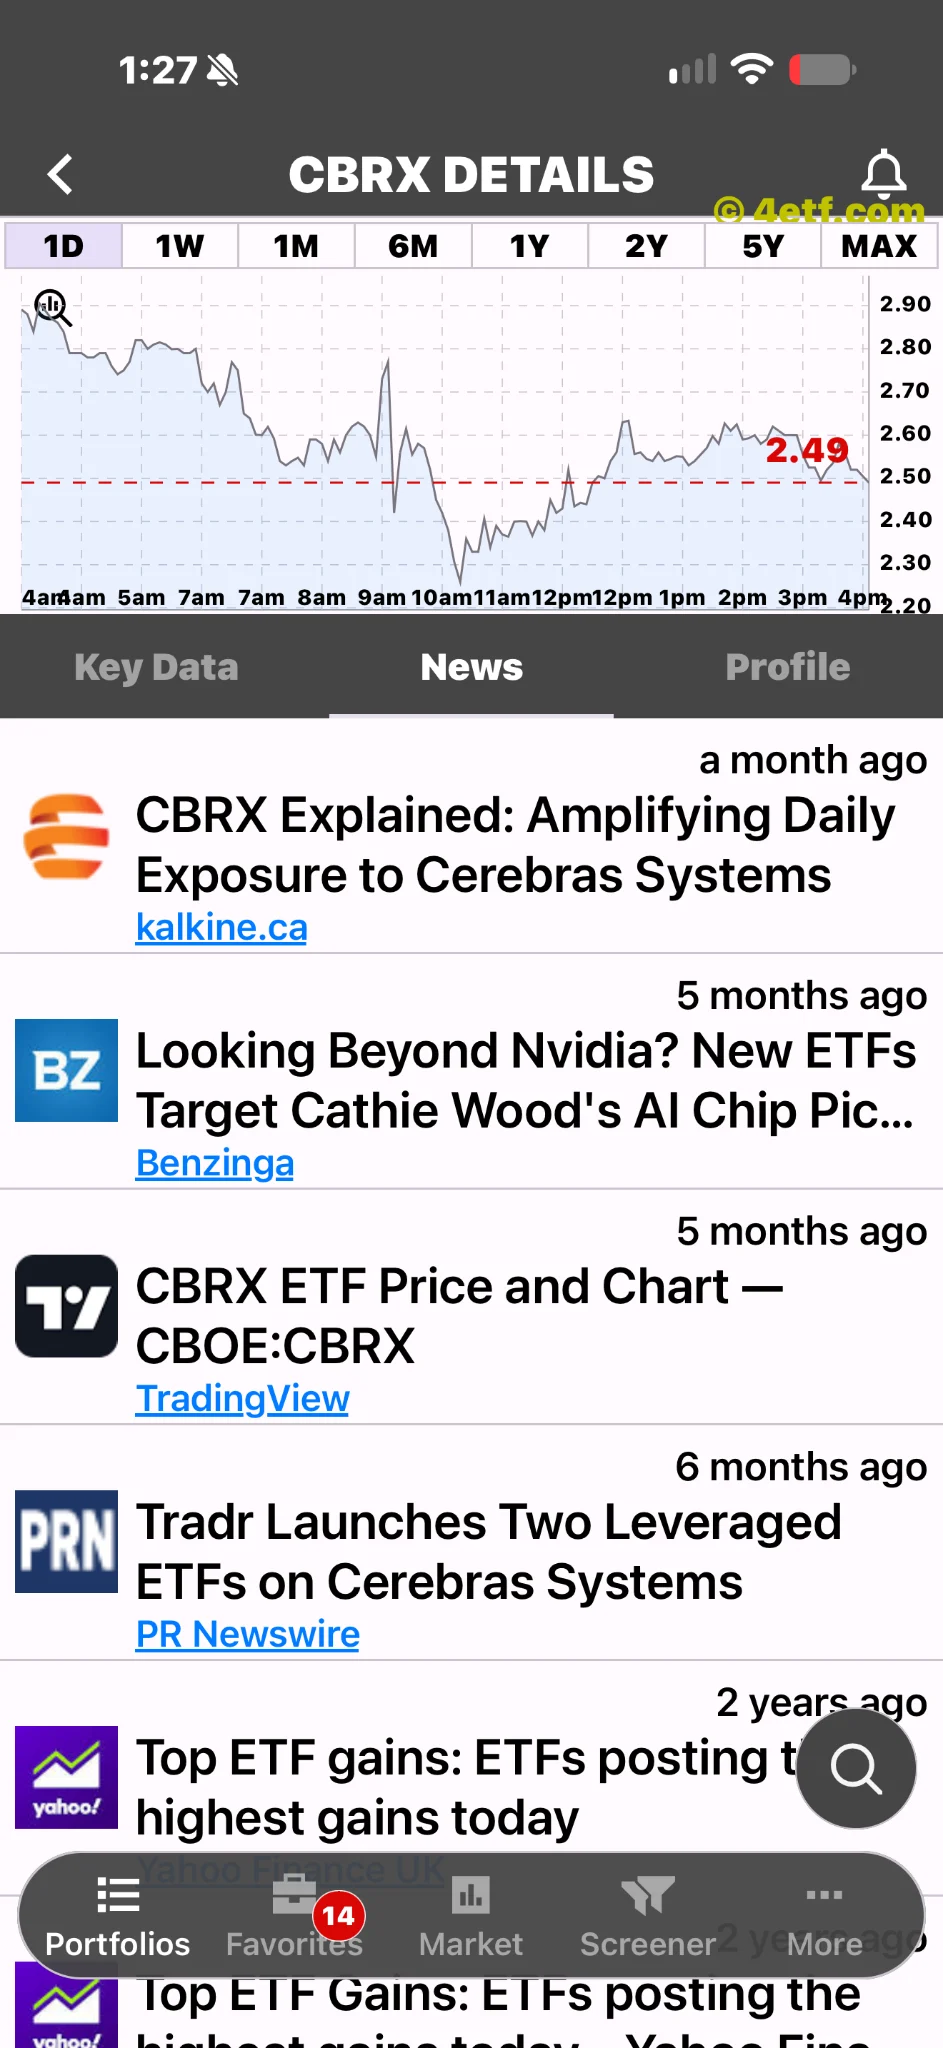
Eric's supplied ETFon dedicated screenshot shows CBRX at $2.49, up +18.01%, with displayed volume of 8,564,301. Those are useful observations from the screen. They are not an independently synchronized measurement of the ETF, its underlying shares and its net asset value. The precise quote timestamp and session have not been independently confirmed.
There is another trap in a small dollar price. A share costing a few dollars can look less demanding than a more expensive stock, but the price of one unit does not tell us whether the exposure is cheap. Position size, leverage and the movement of the underlying business matter much more than the number printed before the decimal point.
The second day is not a replay of the first
The fund targets twice the daily performance before fees and expenses, not twice a multi-day holding-period return. Tradr.
Here is an illustration, not a prediction or an actual CBRX return. An underlying investment rising +10% and then falling -9.09% finishes approximately where it started. An idealized daily two-times position rises +20% and then falls about -18.18%, ending roughly -1.82% below its starting point before costs. The path matters even when the final underlying price appears unchanged.
A good catalyst is not a blank check
Our view is straightforward: the earnings development makes this move more interesting than an unexplained spike. The leverage makes it less forgiving, not more compelling by itself. A useful next check is whether subsequent business disclosures reinforce the improving outlook, while contemporaneous quotes establish what exposure actually costs. The headline should invite investigation, not substitute for it.
Explore ETF information in ETFon. This report explains a market snapshot; it is not a personalized instruction to buy.