
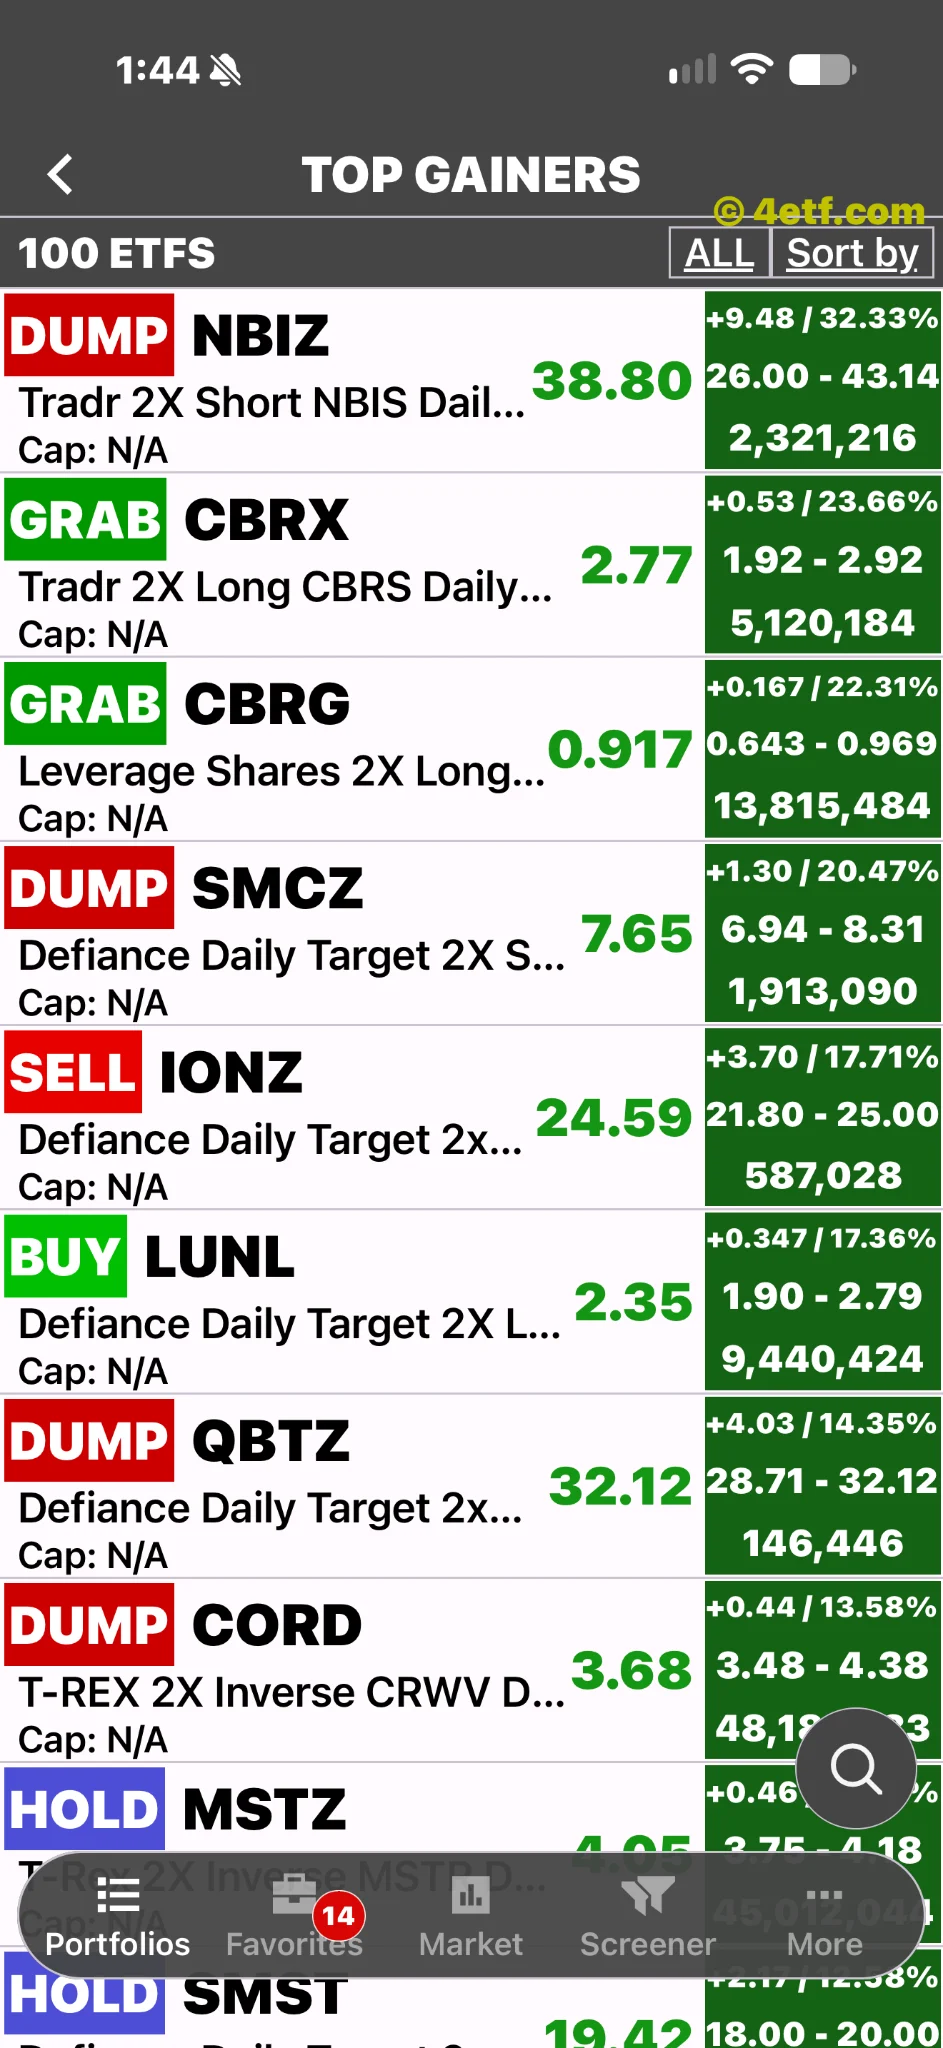
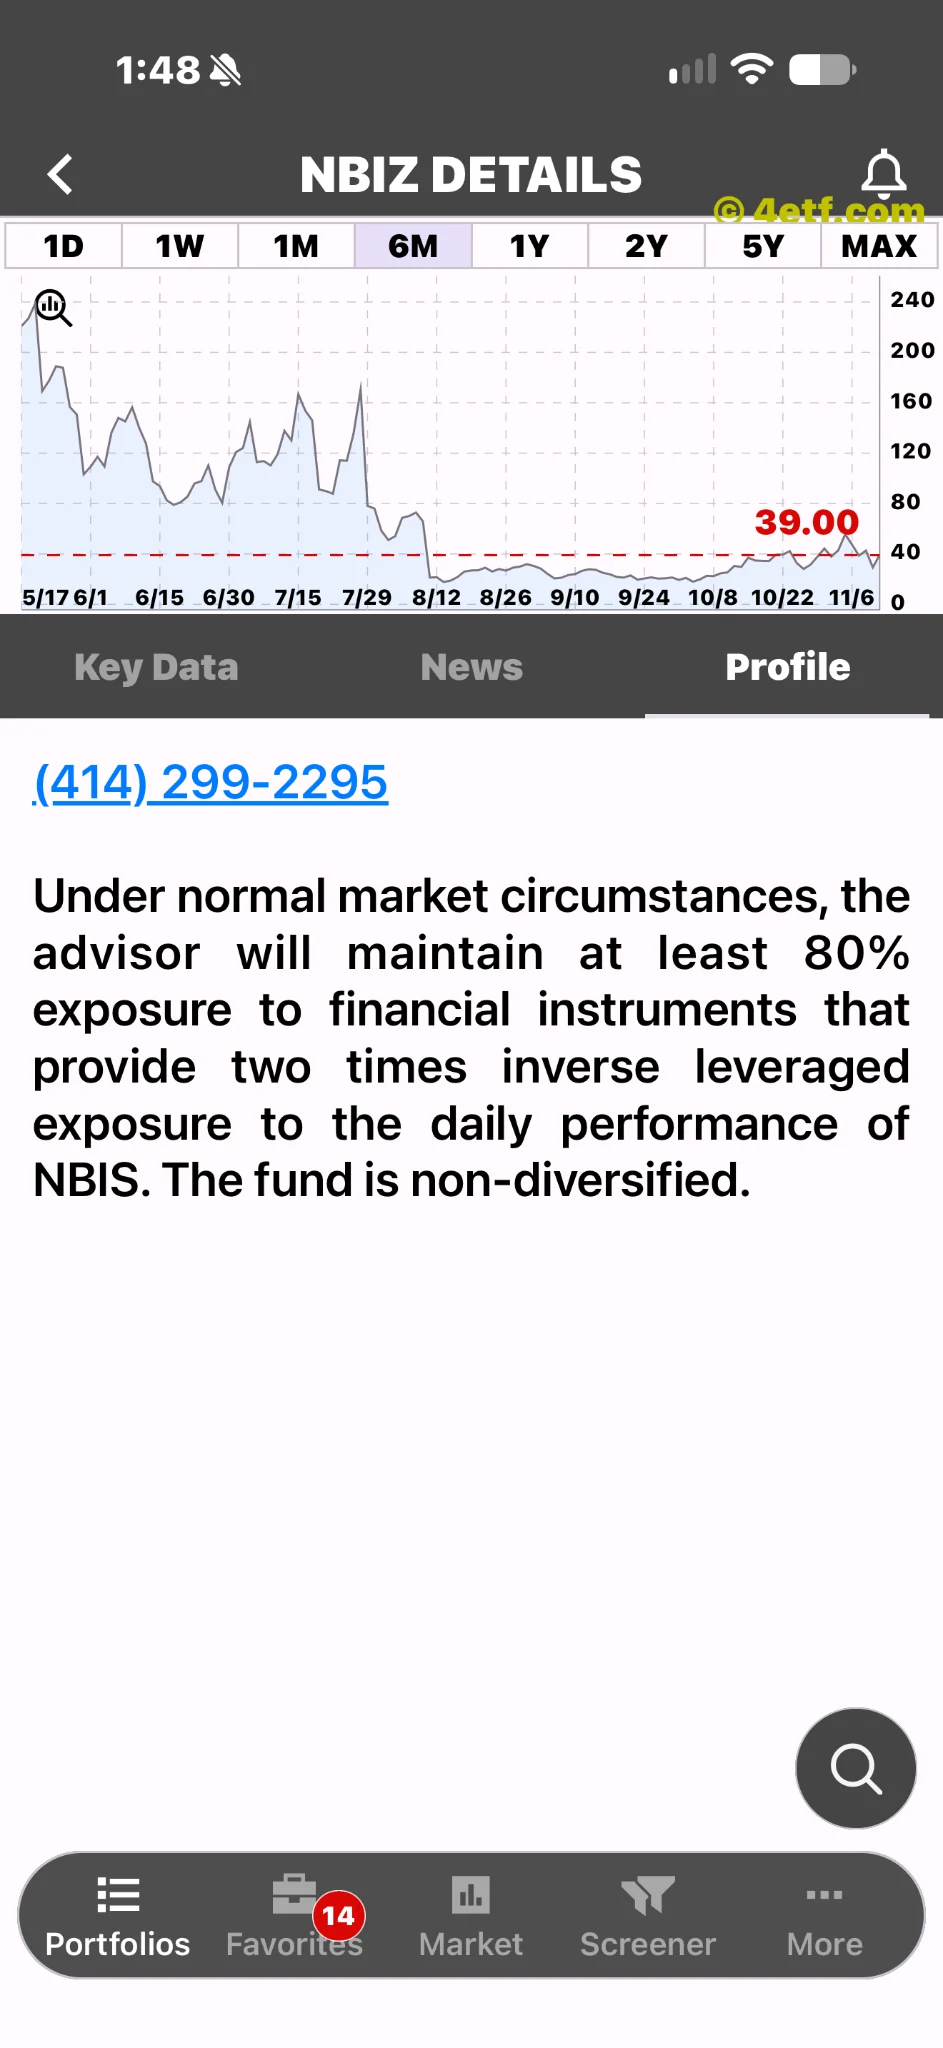
The Tradr 2X Short NBIS Daily ETF does not own a diversified basket of promising technology businesses. It is a bearish, leveraged trading vehicle tied to Nebius, the Amsterdam-based AI cloud company that supplies computing infrastructure to developers and enterprises. When Nebius shares fall, NBIZ is designed to move in the opposite direction, targeting twice the inverse daily percentage move before expenses. That distinction is the key to Thursday’s startling green number.
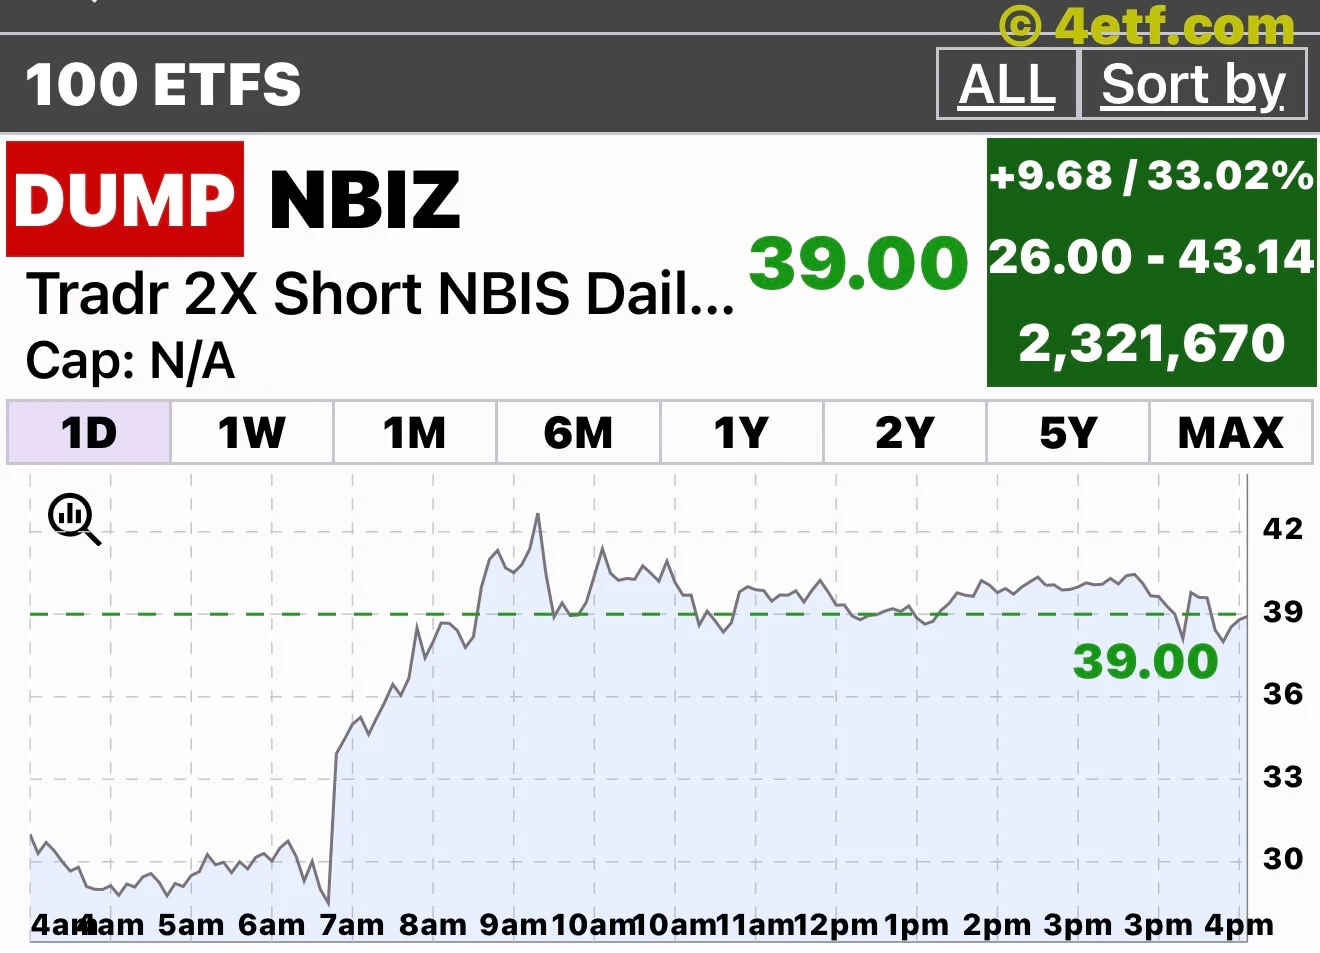
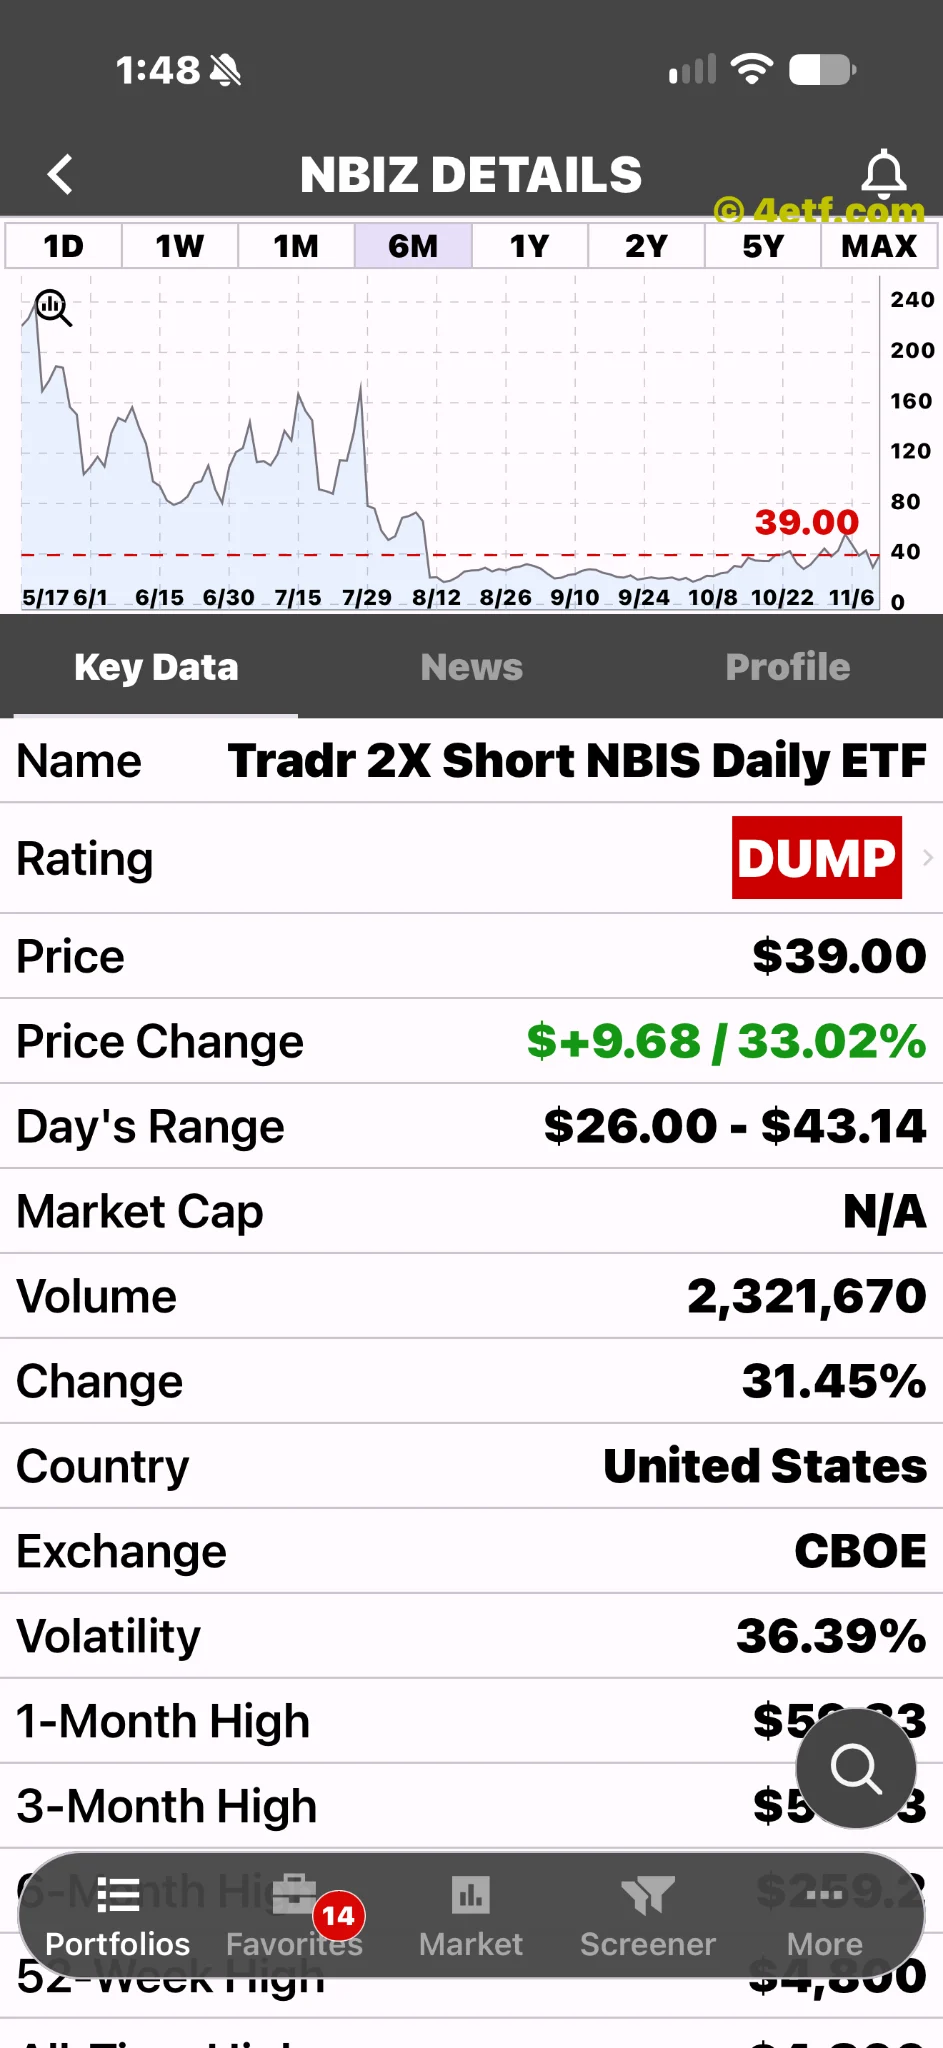
The later individual ETFon screenshots supplied on November 12 showed NBIZ at $39.00, up +$9.68 or 33.02%, with volume of 2,321,670 shares. The earlier overview showed $38.80 and 32.33%; these are different snapshots, not conflicting closing prices. Those are the app’s dated snapshot figures, not a guaranteed execution price or a verified closing return. The fund’s rise is not a vote of confidence in Nebius. It is the market’s bearish response, magnified.
The surprise was in the calendar
Nebius reported September-quarter revenue of $980.8 million, up 571% from a year earlier. About $325 million was non-recurring revenue from the initial phase of an asset-light partnership rollout, so the headline total should not be read as entirely recurring cloud revenue. Yet continuing operations still recorded a $37.5 million net loss. At September 30, current and non-current debt totaled approximately $14.19 billion; that sum is debt carrying value, not total liabilities. These figures describe Nebius, not sales or corporate borrowing by the ETF. Nebius quarterly results.
Why would such explosive growth accompany a falling share price? Because investors buy the future, not just the quarter that has ended. In its November 12 shareholder letter, Nebius said third-party capacity delays were shifting some revenue into early next year. It now expected 2026 revenue at the low end of its $3.0–$3.4 billion range. The annualized revenue milestone previously expected in December moved to February. Management also projected $40–$45 billion of capital expenditure in 2027. Shareholder letter.
That is the uncomfortable combination: some revenue arrives later while the cost of building the business remains enormous. Reuters reported that the guidance revision and capacity delays accompanied a sharp drop in Nebius shares on Thursday. This is a documented earnings-day explanation, not a claim to know every trader’s motives. Reuters coverage.
Why NBIZ amplified the disappointment
The fund’s mandate turns an underlying decline into a potential gain. In a simplified example, a 10% daily fall in Nebius would imply a 20% positive daily target for NBIZ before fees and tracking differences. Conversely, a 10% rise would imply a 20% loss. The issuer lists a 1.49% expense ratio and explicitly limits the target to one trading day. Tradr fund details.
The encouraging part of this structure is precision: an experienced trader can express a short-term bearish view without treating an inverse fund as an ordinary growth investment. The dangerous part is how easily a big gain disguises that distinction. Buying NBIZ after the jump does not give a new buyer the gain already shown on the screen.
Daily resetting also means the fund does not promise twice the inverse return over a month. In a hypothetical frictionless example, an underlying stock falling 10% and then rising 11.11% returns roughly to its starting point. A perfectly tracking inverse 2x fund would first gain 20%, then lose 22.22%, leaving it about 6.67% below its starting value. This is a mathematical illustration, not a prediction.
A strong explanation is not a buy signal
Nebius’s longer-term business could succeed while short-term execution disappoints. Equally, a rebound in its shares could hurt NBIZ quickly. Today’s lesson is that excellent reported growth can lose an argument against delayed capacity and rising investment needs.
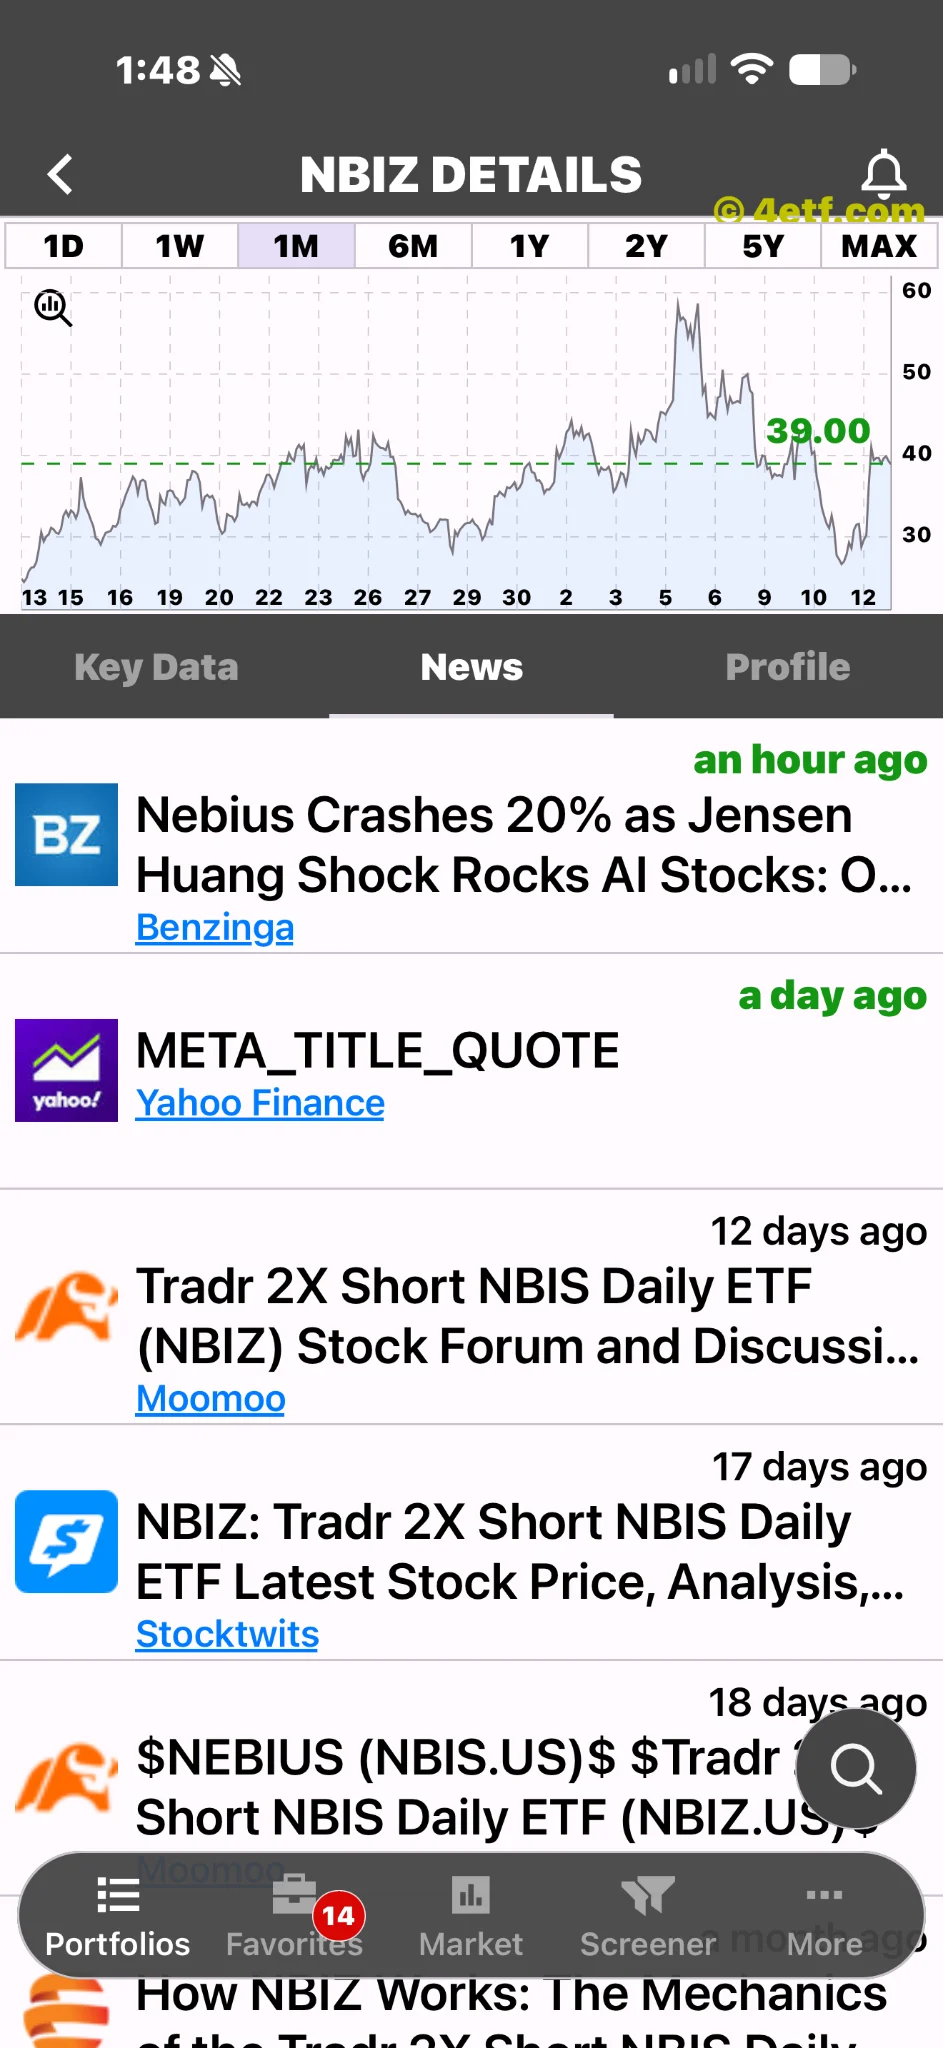
The six-month chart tells a sobering story behind the daily gain: NBIZ generally fell sharply from May through August and then traded near much lower levels. The latest month looks different, with a volatile recovery, a spike around early November and another sharp setback before this rebound. That is improvement from recent lows, not a clean reversal of the longer decline. The intraday chart shows a rapid morning surge followed by choppy trading near $39. These are visual descriptions, not precisely calculated holding-period returns; the screenshots do not establish the chart’s distribution or split adjustments. For a daily-reset inverse fund, the path matters as much as direction. Nebius disappointed on timing, its shares fell, and NBIZ’s inverse daily exposure amplified the reaction.
Explore ETF behavior with ETFon App at All-ETFs.app. This article explains the instrument and a dated market move, not a recommendation to buy it.