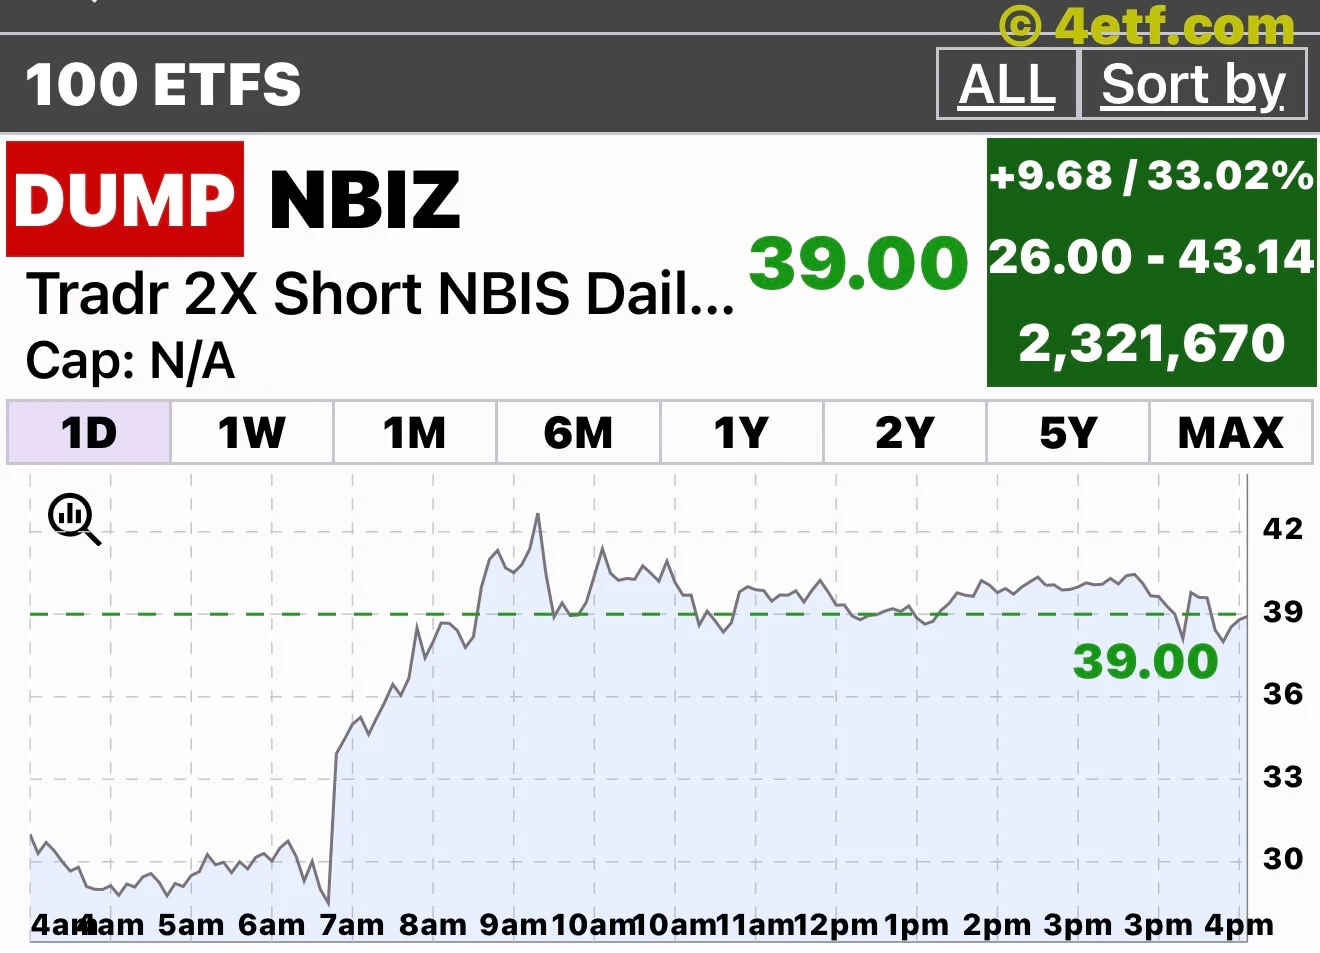

CoreWeave rents high-performance computing infrastructure to artificial-intelligence customers. It is no tiny speculative operation: in the quarter ended September 30, 2026, revenue reached $3.661 billion, but its GAAP net loss was $709 million. Its balance sheet listed $46.873 billion of current and noncurrent recourse and non-recourse debt, excluding leases. These are CoreWeave's figures, not the finances of CORD, the exchange-traded fund taking the other side of its shares. CoreWeave results
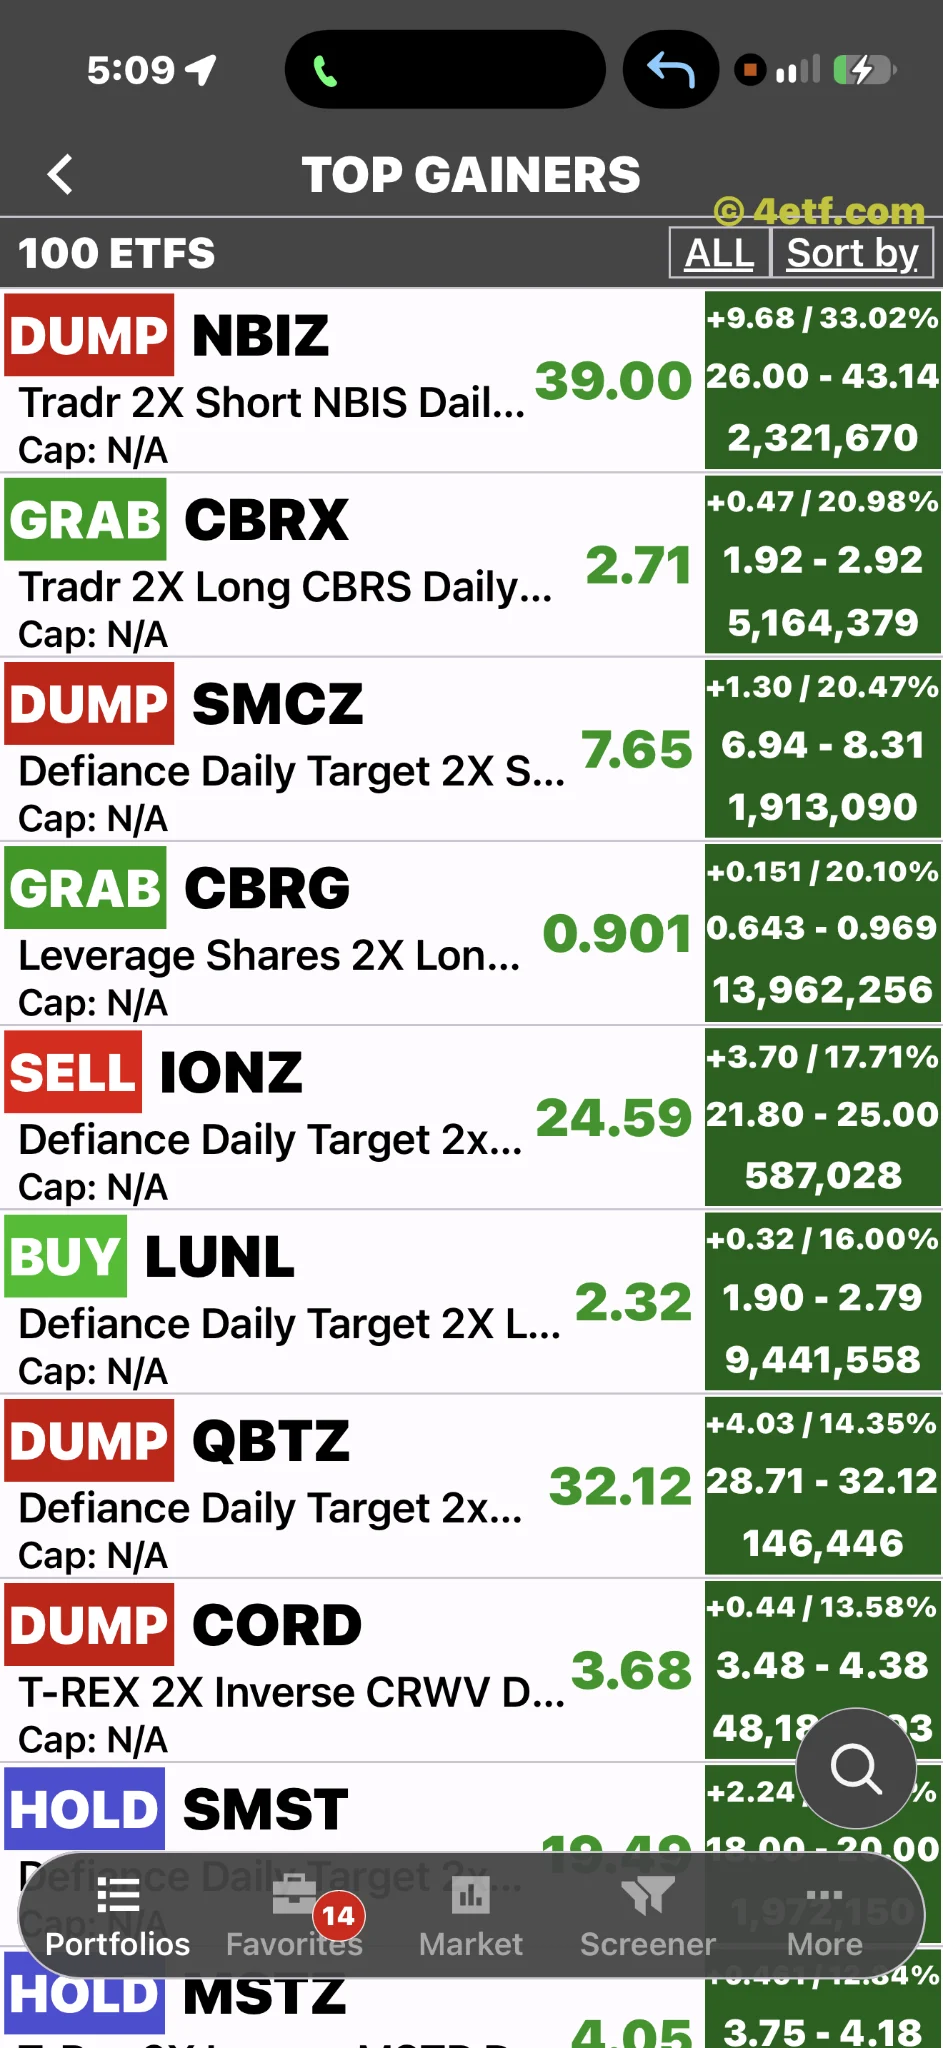
That distinction explains the apparent contradiction on November 12: CORD could have a good day precisely because the underlying company had a bad day in the market. The supplied ETFon snapshot shows CORD at $3.68, up +$0.44, or 13.58%. It is an app snapshot, not a promise of the price available now. The important story is not simply that another ETF jumped. It is how violently a leveraged bearish position can change fortunes from one session to the next.
Why the inverse trade worked
The T-REX 2X Inverse CRWV Daily Target ETF seeks minus twice CoreWeave's daily share-price performance before fees and expenses. Reuters reported that CoreWeave fell 6.9% on November 12 as the Nvidia-led selloff weighed on AI shares. That decline supplies the direct market mechanism for CORD's gain. The precise fund return can differ because of timing, costs and tracking. Fund objective; Reuters market report
It would be too neat to assign every seller the same motive. A market story is not a transcript of every trade. But the sequence matters: CoreWeave's strong earnings reaction was followed by a reversal in the surrounding AI trade. This is a story about changing risk appetite as well as a business that must turn expensive infrastructure into lasting financial returns.
A rebound is not a recovery
Here is the uncomfortable comparison. REX's November 11 data show CORD's net asset value at $3.24 after a 49.53% daily decline. Its reported dollar drop was $3.18, implying a preceding NAV of $6.42. A fund that loses roughly half its value needs approximately a 100% gain to recover, not another 50%. The issuer figures are NAV observations, whereas the screenshot shows a market quote; they should not be spliced together as an investor’s total-return series. REX dated fund data
A large green percentage therefore need not mean that a patient holder is back in the money. Someone who bought after the decline and someone who held through it can have completely different experiences even while looking at the same day's leaderboard. That is the part a simple ranking cannot show.
The daily clock changes the wager
Daily resetting makes the path important. As an illustrative calculation, imagine an underlying share rises 20%, then falls 10%. It finishes 8% above its starting point. A hypothetical perfect minus-two-times daily fund would fall 40%, then rise 20%, leaving it 28% below its starting point, not 16% below. Real funds add expenses, financing and execution effects. The example is arithmetic, not a forecast for either security. SEC explanation of leveraged and inverse funds
That makes CORD a demanding trading instrument, not a low-maintenance way to express skepticism indefinitely. A fresh rebound in CoreWeave can punish it quickly. Conversely, further weakness could help it, but that outcome is not guaranteed by the company's debt or last quarter's loss.
No individual six-month or one-month CORD chart was supplied with this leaderboard, so a longer-term chart trend cannot responsibly be inferred from it. Today's gain is real in the supplied snapshot; tomorrow's direction is a separate question. Follow ETF information through ETFon App, but judge the objective, holding period and risk before treating a top-gainer label as an investment case.